
Spring Boot集成tablesaw插件快速入门
1 什么是tablesaw?
Tablesaw是一款Java的数据可视化库,主要包括两部分:
-
数据解析库,主要用于加载数据,对数据进行操作(转化,过滤,汇总等),类比Python中的Pandas库;
-
数据可视化库,将目标数据转化为可视化的图表,类比Python中的Matplotlib库。
与Pandas不同的是,Tablesaw中的表格以列(Column)为基本单位,因此大部分操作都是基于列进行的。当然也包括部分对行操作的函数,但是功能比较有限
1.1 tablesaw目录说明
-
aggregate:maven 的项目父级项目,主要定义项目打包的配置。
-
beakerx:tablesaw 库的注册中心,主要注册表和列。
-
core:tablesaw 库的核心代码,主要是数据的加工处理操作:数据的追加,排序,分组,查询等。
-
data:项目测试数据目录。
-
docs:项目 MarkDown 文档目录。
-
docs-src:项目文档源码目录,主要作用是生成 MarkDown 文档。
-
excel:解析 excel 文件数据的子项目。
-
html:解析 html 文件数据的子项目。
-
json:解析 json 文件数据的子项目。
-
jsplot:数据可视化的子项目,主要作用加载数据生成可视化图表。
-
saw:tablesaw 读写图表数据的子项目。
2 环境准备
2.1 数据库安装
数据库安装这里不做详细阐述,小伙伴们可自行安装,在docker环境下可执行:
docker run --name docker-mysql-5.7 -e MYSQL_ROOT_PASSWORD=123456 -p 3306:3306 -d mysql:5.7
2.2 数据库表初始化
create database springboot_demo;
create table user_info
(
user_id     varchar(64)          not null primary key,
username    varchar(100)         null ,
age         int(3)               null ,
gender      tinyint(1)           null ,
remark      varchar(255)         null ,
create_time datetime             null ,
create_id   varchar(64)          null ,
update_time datetime             null ,
update_id   varchar(64)          null ,
enabled     tinyint(1) default 1 null
);
INSERT INTO springboot_demo.user_info
(user_id, username, age, gender, remark, create_time, create_id, update_time, update_id, enabled)
VALUES('1', '1', 1, 1, '1', NULL, '1', NULL, NULL, 1);
3 代码demo
3.1 完成目标
利用tablesaw加工和处理二维数据,并且可视化
3.2 pom.xml
        springboot-demo
        com.wkf
        1.0-SNAPSHOT

    4.0.0
    tablesaw

        8
        8


            org.springframework.boot
            spring-boot-starter-web


            org.springframework.boot
            spring-boot-autoconfigure


            org.springframework.boot
            spring-boot-starter-test
            test


            tech.tablesaw
            tablesaw-core
            0.43.1


            tech.tablesaw
            tablesaw-jsplot
            0.43.1


            org.springframework.boot
            spring-boot-starter-jdbc


            mysql
            mysql-connector-java
            8.0.29
3.3 application.yaml
server:
  port: 8088
spring:
  datasource:
    driver-class-name: com.mysql.cj.jdbc.Driver
    type: com.zaxxer.hikari.HikariDataSource
    url: jdbc:mysql://127.0.0.1:3305/springboot_demo?useUnicode=true&characterEncoding=utf-8&useSSL=false
    username: root
    password: 123456
3.4 读取csv数据
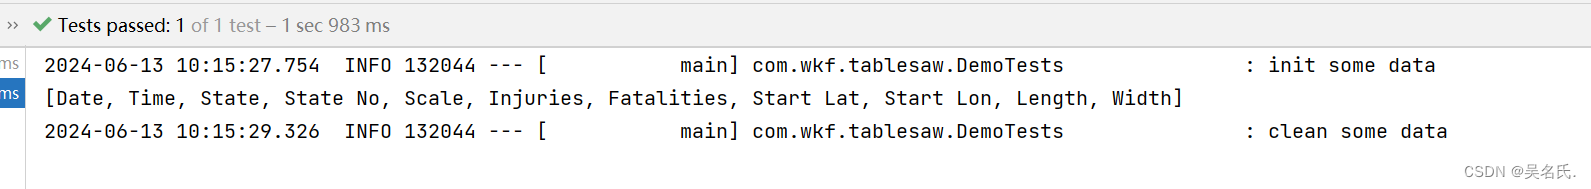
    @Before
    public void before() {
        log.info("init some data");
        tornadoes = Table.read().csv("D:/gitProject/springboot-demo/tablesaw/src/main/resources/data/tornadoes_1950-2014.csv");
    }
3.5 打印列名
    @Test
    public void columnNames() {
        System.out.println(tornadoes.columnNames());
    }
运行效果:
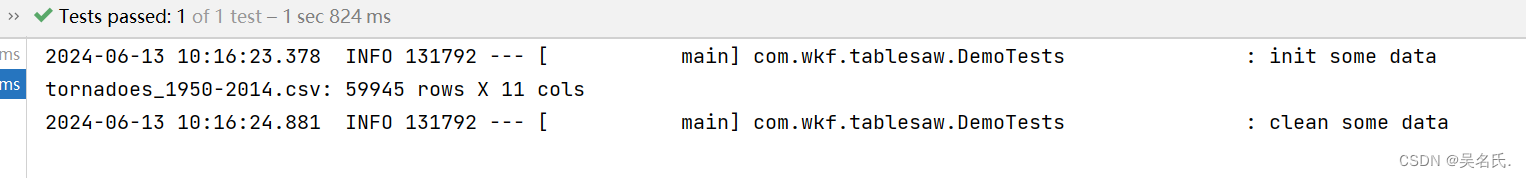
3.6 查看shape
    @Test
    public void shape() {
        System.out.println(tornadoes.shape());
    }
运行效果:
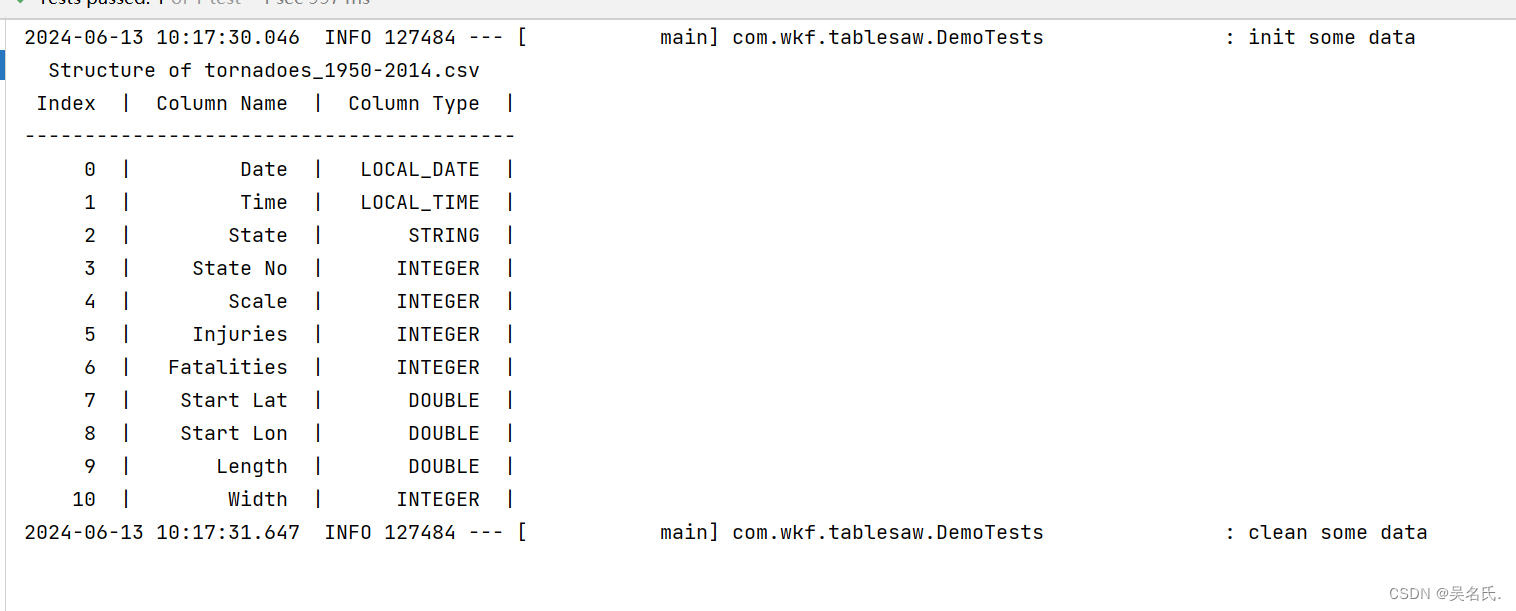
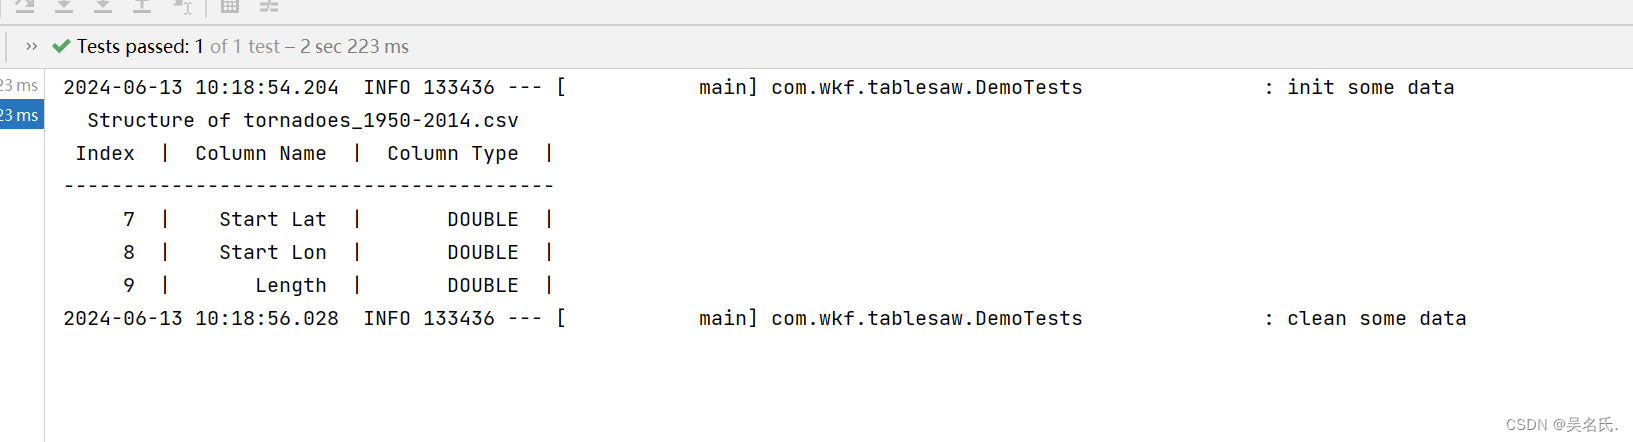
3.7 查看表结构
    @Test
    public void structure() {
        System.out.println(tornadoes.structure().printAll());
    }
运行效果:
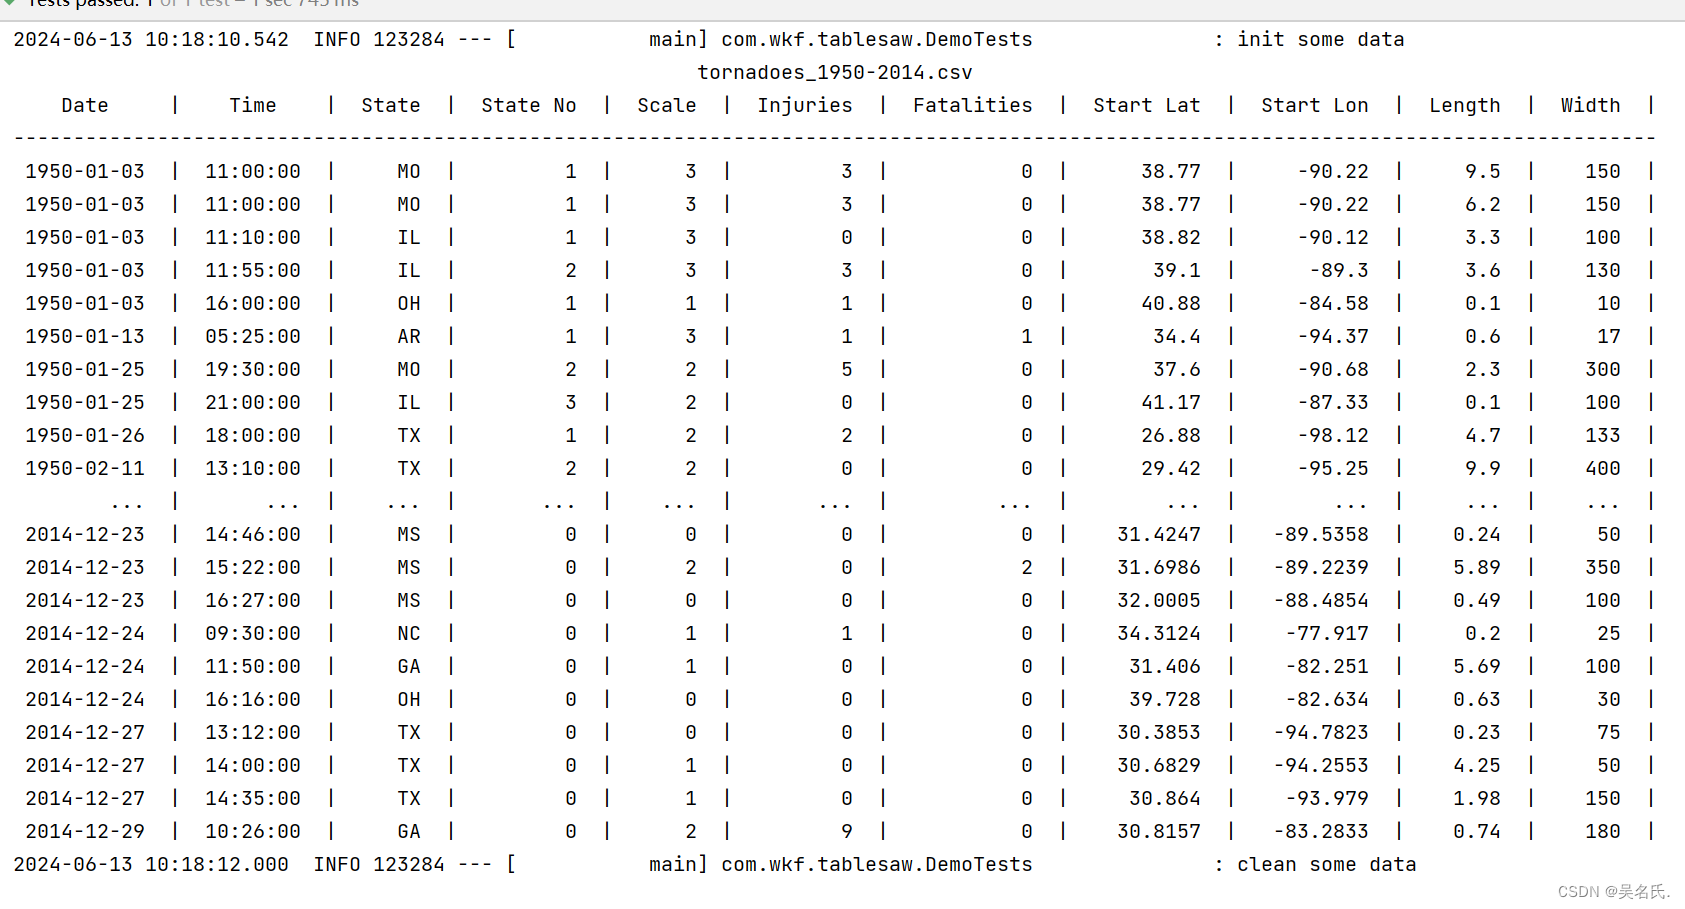
3.8 查看数据
    @Test
    public void show() {
        System.out.println(tornadoes);
    }
运行效果:
3.9 表结构过滤
    @Test
    public void structurefilter() {
        System.out.println( tornadoes
                .structure()
                .where(tornadoes.structure().stringColumn("Column Type").isEqualTo("DOUBLE")));
    }
运行效果:
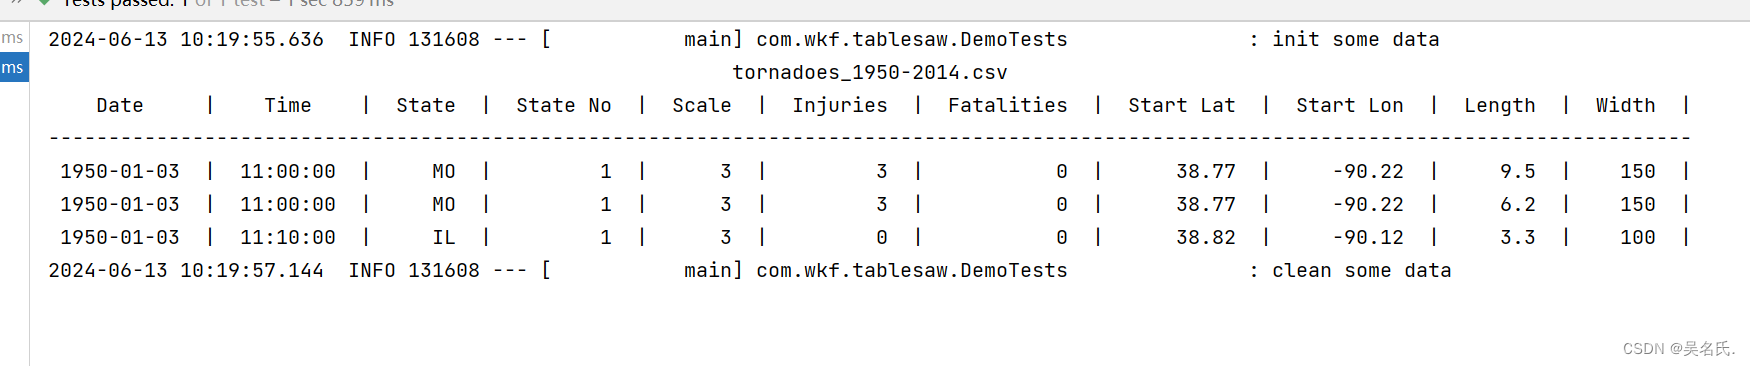
3.10 预览数据
	@Test
    public void previewdata() {
        System.out.println(tornadoes.first(3));
    }
运行效果:
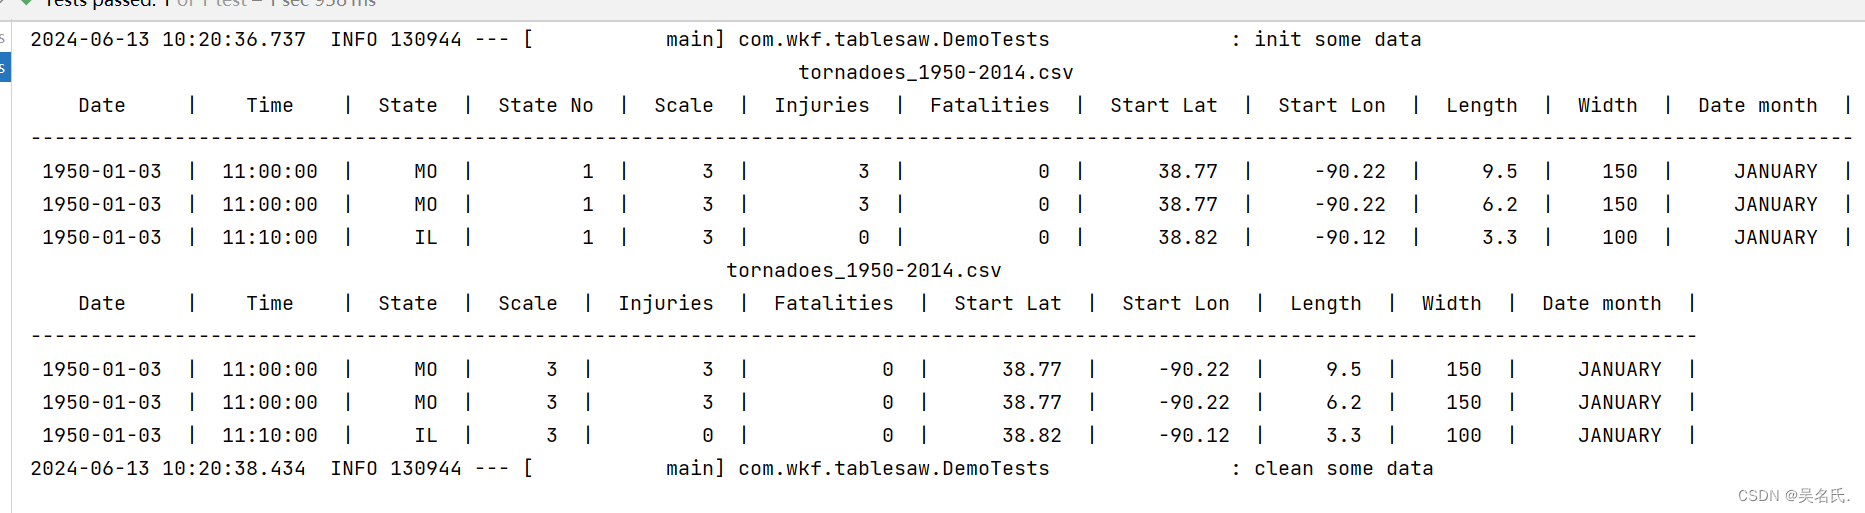
3.11 列操作
    @Test
    public void ColumnOperate() {
        StringColumn month = tornadoes.dateColumn("Date").month();
        tornadoes.addColumns(month);
        System.out.println(tornadoes.first(3));
        tornadoes.removeColumns("State No");
        System.out.println(tornadoes.first(3));
    }
运行效果:
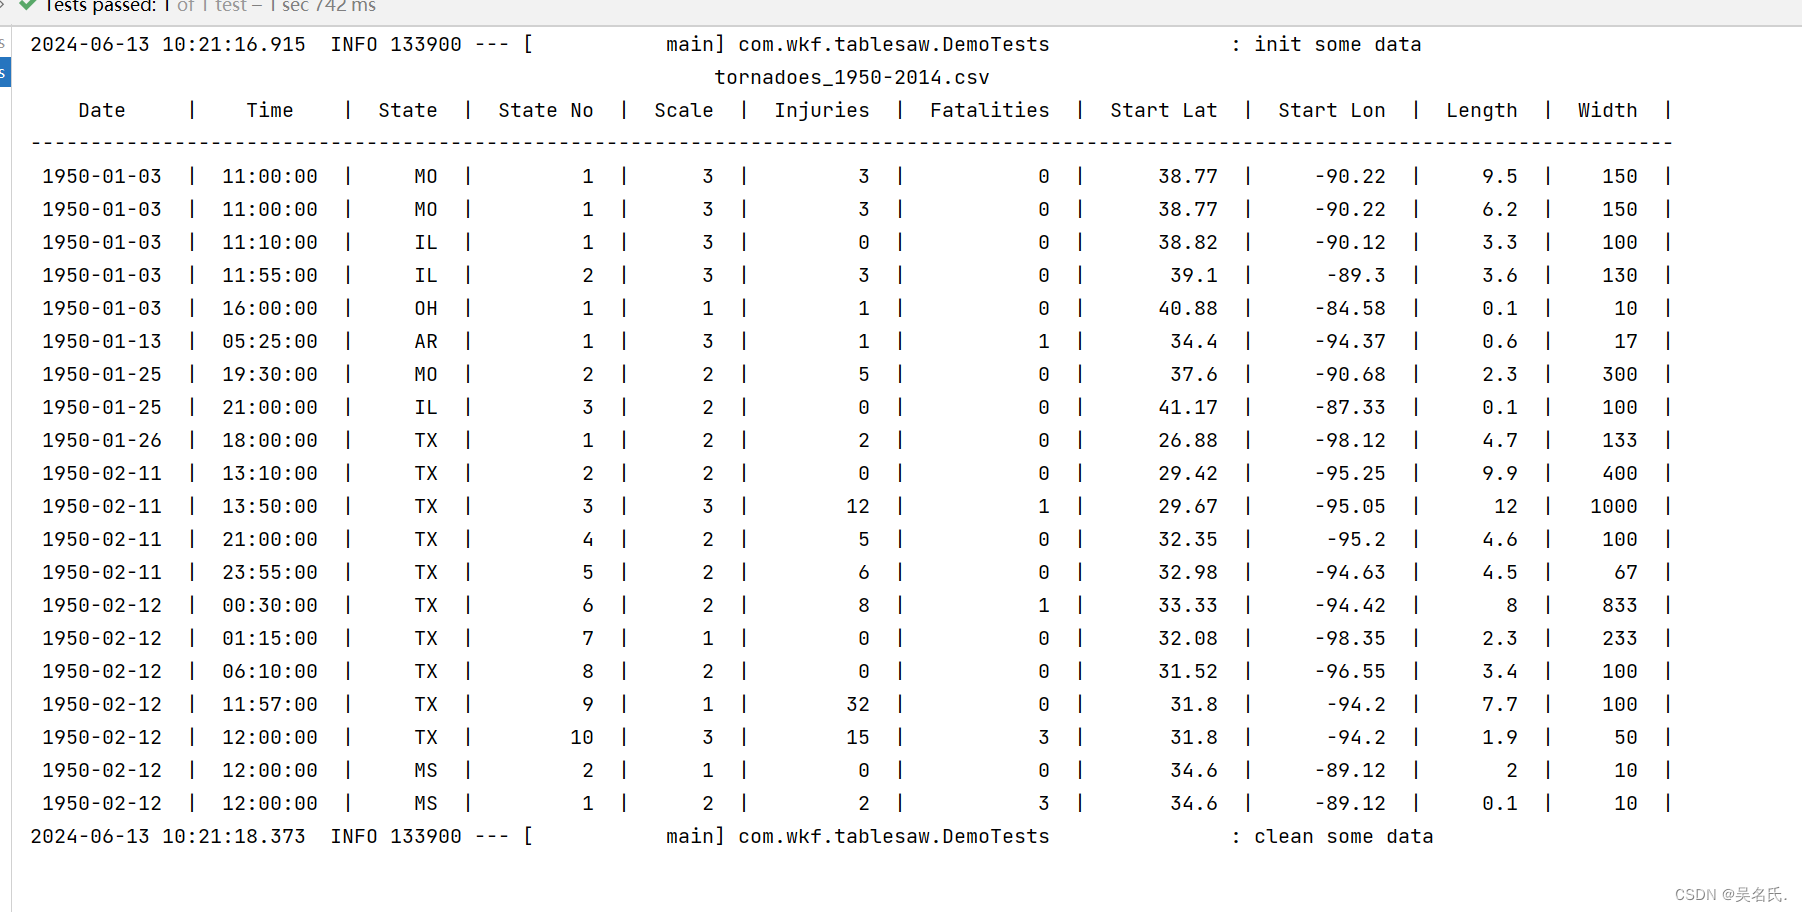
3.12 排序
    @Test
    public void sort() {
        tornadoes.sortOn("-Fatalities");
        System.out.println(tornadoes.first(20));
    }
运行效果:
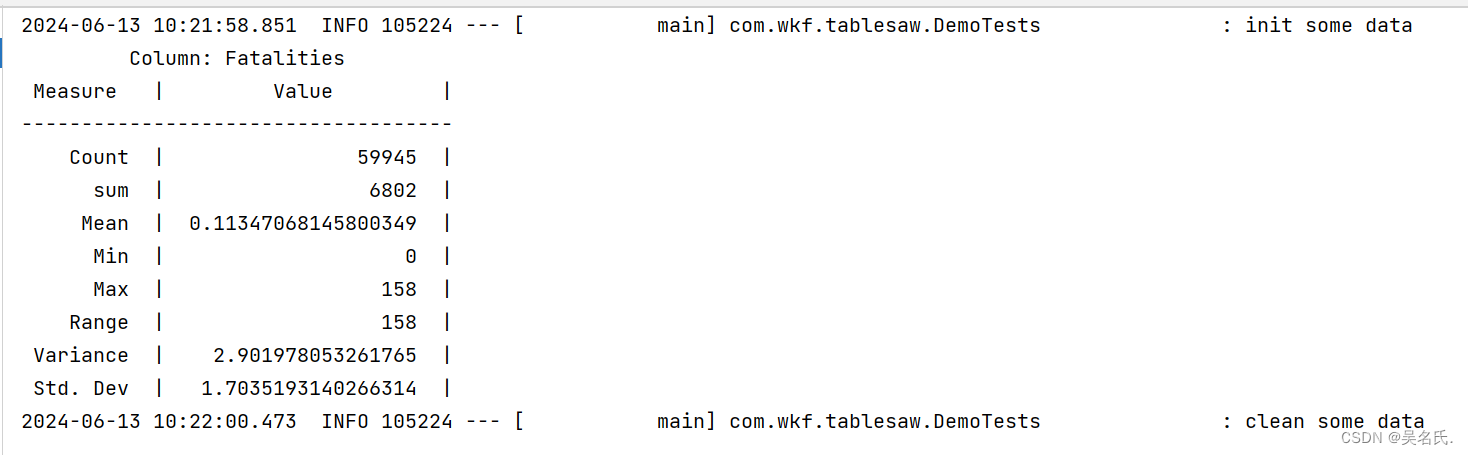
3.13 summary
    @Test
    public void summary() {
        System.out.println( tornadoes.column("Fatalities").summary().print());
    }
运行效果:
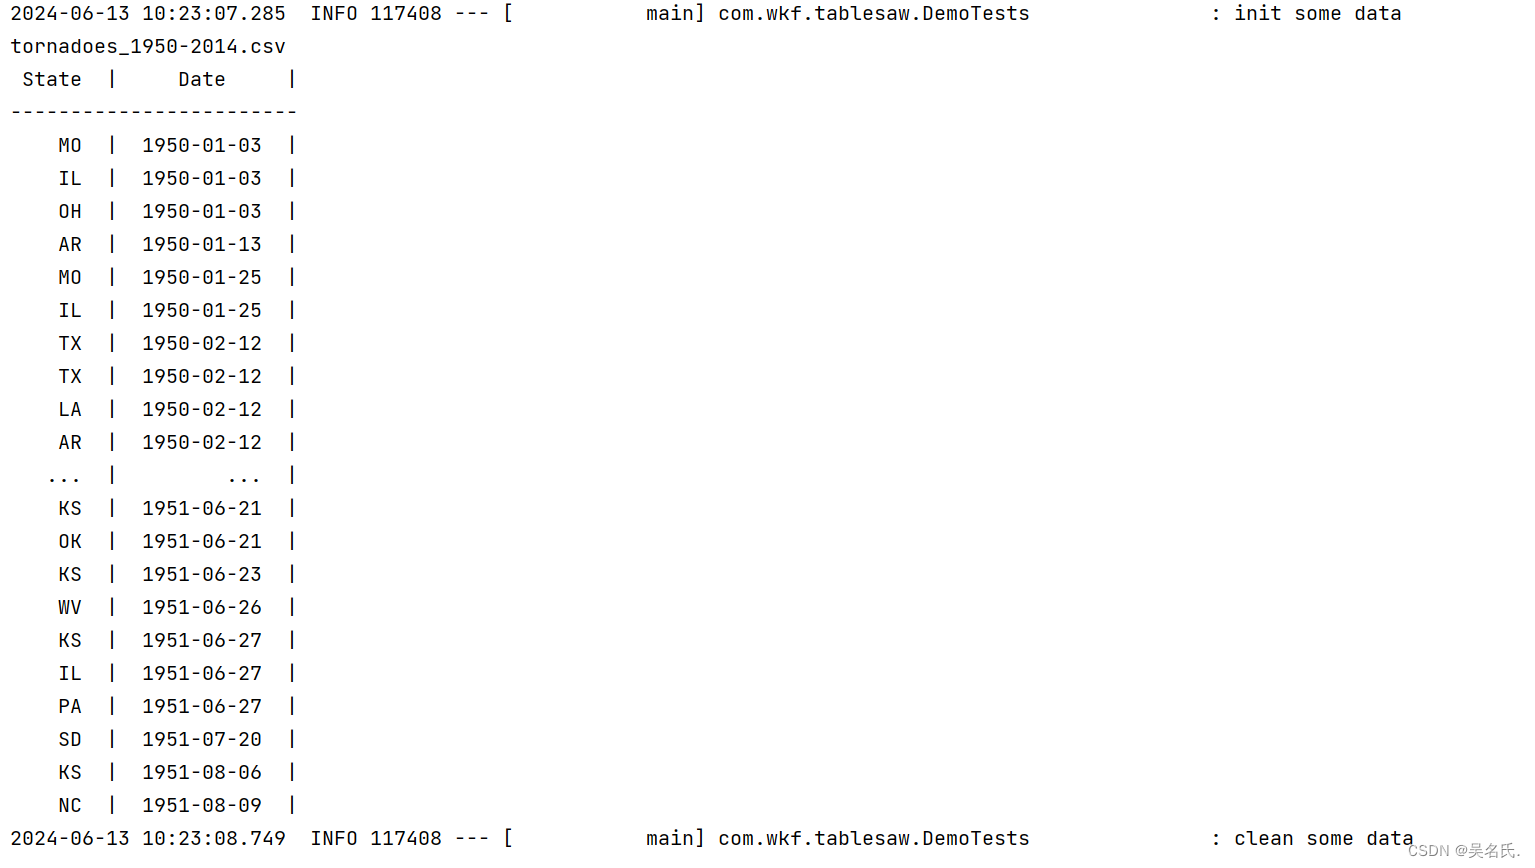
3.14 数据过滤
    @Test
    public void filter() {
        Table result = tornadoes.where(tornadoes.intColumn("Fatalities").isGreaterThan(0));
        result = tornadoes.where(result.dateColumn("Date").isInApril());
        result =
                tornadoes.where(
                        result
                                .intColumn("Width")
                                .isGreaterThan(300) // 300 yards
                                .or(result.doubleColumn("Length").isGreaterThan(10))); // 10 miles
        result = result.select("State", "Date");
        System.out.println(result);
    }
运行效果:
3.15 写入文件
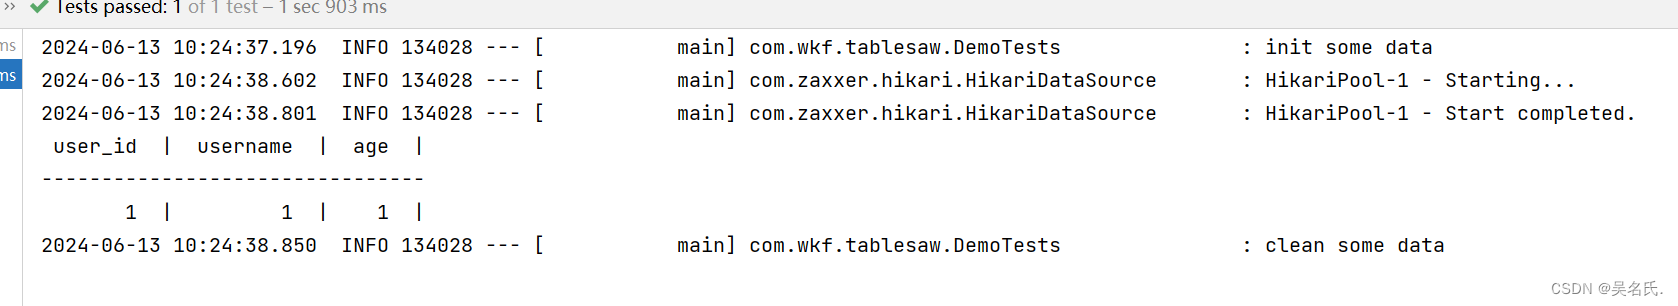
    @Test
    public void write() {
        tornadoes.write().csv("rev_tornadoes_1950-2014-test.csv");
    }
3.16 从mysql读取数据
    @Resource
    private JdbcTemplate jdbcTemplate;

    @Test
    public void dataFromMySql() {
        Table table = jdbcTemplate.query("SELECT  user_id,username,age from user_info", resultSet -> {
            return Table.read().db(resultSet);
        });
        System.out.println(table);
    }
运行效果:
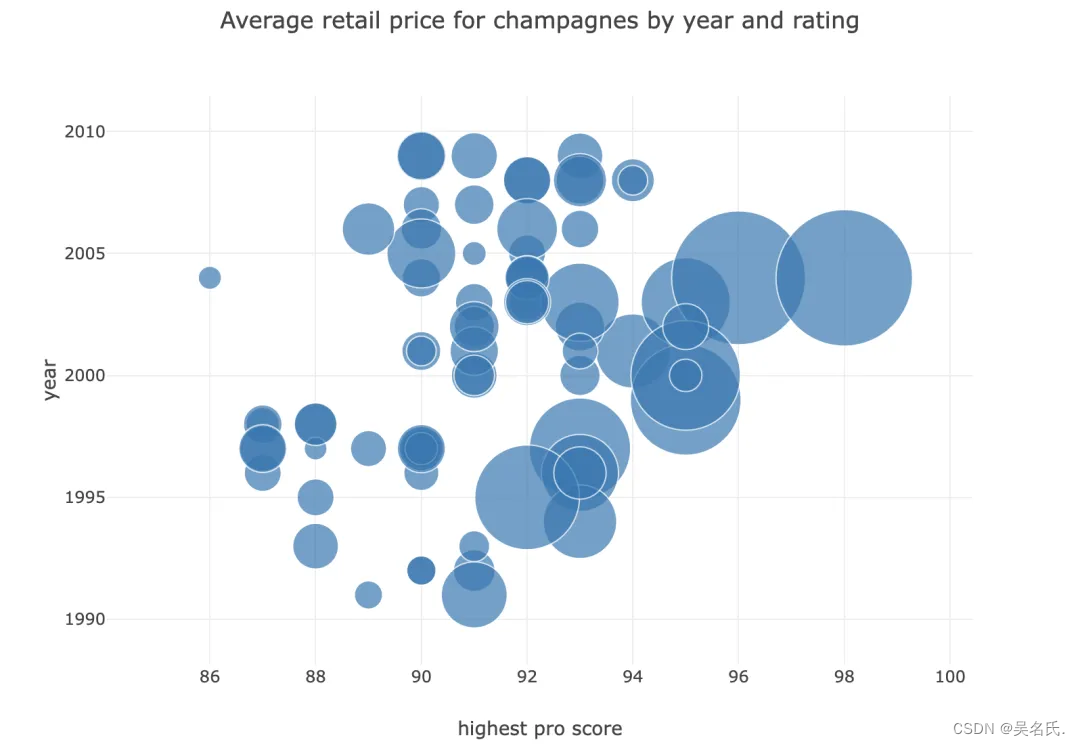
3.17 数据可视化
package com.wkf.tablesaw;
import tech.tablesaw.api.Table;
import tech.tablesaw.plotly.Plot;
import tech.tablesaw.plotly.api.BubblePlot;
import tech.tablesaw.plotly.components.Figure;
import java.io.IOException;
/**
 * @author wuKeFan
 * @date 2024-06-13 09:57:07
 */
public class BubbleExample {
    public static void main(String[] args) throws IOException {
        Table wines = Table.read().csv("D:/gitProject/springboot-demo/tablesaw/src/main/resources/data/tornadoes_1950-2014.csv");
        Table champagne =
                wines.where(
                        wines
                                .stringColumn("wine type")
                                .isEqualTo("Champagne & Sparkling")
                                .and(wines.stringColumn("region").isEqualTo("California")));
        Figure figure =
                BubblePlot.create(
                        "Average retail price for champagnes by year and rating",
                        champagne, // table namex
                        "highest pro score", // x variable column name
                        "year", // y variable column name
                        "Mean Retail" // bubble size
                );
        Plot.show(figure);
    }
}
结果如下图:
4 代码仓库
https://github.com/363153421/springboot-demo/tree/master/tablesaw
-
免责声明:我们致力于保护作者版权,注重分享,被刊用文章因无法核实真实出处,未能及时与作者取得联系,或有版权异议的,请联系管理员,我们会立即处理! 部分文章是来自自研大数据AI进行生成,内容摘自(百度百科,百度知道,头条百科,中国民法典,刑法,牛津词典,新华词典,汉语词典,国家院校,科普平台)等数据,内容仅供学习参考,不准确地方联系删除处理! 图片声明:本站部分配图来自人工智能系统AI生成,觅知网授权图片,PxHere摄影无版权图库和百度,360,搜狗等多加搜索引擎自动关键词搜索配图,如有侵权的图片,请第一时间联系我们,邮箱:ciyunidc@ciyunshuju.com。本站只作为美观性配图使用,无任何非法侵犯第三方意图,一切解释权归图片著作权方,本站不承担任何责任。如有恶意碰瓷者,必当奉陪到底严惩不贷!


