
【python 的各种模块】(6) 如何用matplotlib来画多个图形,子图,以及图中图
温馨提示:这篇文章已超过367天没有更新,请注意相关的内容是否还可用!
目录
1 前言&抛出问题:如何用matplotlib画多个图形?
1.1 matplotlib.pyplot里 figure下的层级,画布和图形的层级
1.2 根据 matplotlib.pyplot里 figure下的层级
1.2.1 情况1:一个画布里画图
1.2.2 情况2:代码里创建多个figure,分别作图
1.2.3 情况3:子图概念
1.2.4 情况4:图中图
2 用matplotlib 画多个函数图形
2.1 情况1:在一个画布的画图
2.2 情况2:在多个画布里,分别画图
3 情况3:一个画布里作图多个子图(多种方法)
3.1 用plt.subplot()方式绘制多子图
3.1.1 plt.subplot()基本语法
3.1.2 特殊点
3.1.3 测试代码
3.2 用plt.subplots() 方式绘制多子图
3.2.1 plt.subplots() 的基本语法
3.2.2 作图步骤
3.2.3 直接修改 plt.subplot的代码,修改为 plt.subplots
3.3 使用fig.add_subplot() 函数绘制图中图
3.3.1 基本语法
3.3.2 测试代码
4 情况4:用fig.add_axes() 实现图中图(其实是子图的一种)
4.1 基本语法
4.2 步骤
4.3 测试代码1
4.4 测试代码2
4.4.1 添加子图区域
4.4.2 定义子图区域的位置和大小 ax1=fig.add_axes([left, bottom, width, height])
4.4.3 设置图例和标题,都是每个子图区域单独一套(独立显示)
1 前言&抛出问题:如何用matplotlib画多个图形?
如果要画多个图形,可能有各种情况,我大致整理为下面4种:
- 情况1
- 情况2
- 情况3
- 情况4
1.1 matplotlib.pyplot里 figure下的层级,画布和图形的层级
- 第1层: figure 画布
- 第2层: axes 子图
- 第3层: axis 坐标轴
1.2 根据 matplotlib.pyplot里 figure下的层级
1.2.1 情况1:一个画布里画图
- 可以在一个画布里只有1套坐标轴,画1个图形
- 可以在一个画布里只有1套坐标轴,画多个图形,叠加显示在一起
1.2.2 情况2:代码里创建多个figure,分别作图
- 如果代码里有多个figure
- 可以在每个figure画布里,有1套坐标轴和画1个图形
1.2.3 情况3:子图概念
- 代码里只有1个figure
- 但是里面可以有多个子图:axes
- 每个子图
- 包含一套坐标轴系
- 包含1个或多个图形
1.2.4 情况4:图中图
- 代码里有2个figure
- 1个figure正常显示一个或多个图形
- 另外一个figure,内嵌在这个figure里
2 用matplotlib 画多个函数图形
2.1 情况1:在一个画布的画图
- 1张画布,1个坐标轴系,多个图形叠在一起
- 这种情况下,图形比较适合进行对比,比较
import numpy as np
import matplotlib.pyplot as plt
fig1=plt.figure(num=1)
x=np.linspace(-5,5, 10)
y=x*2+1
y2=x**2
# 绘图
plt.plot(x, y)
plt.plot(x, y2)
# 显示图像
plt.show()

2.2 情况2:在多个画布里,分别画图
- 多张画布
- 多个坐标轴系
- 每个画布里分别包含1个/多个图形
import numpy as np
import matplotlib.pyplot as plt
x=np.linspace(-5,5, 10)
fig1=plt.figure(num=1,figsize=(3,3))
y=x*2+1
# 绘图
plt.plot(x, y)
#新开一个画布
fig2=plt.figure(num=2,figsize=(5, 5))
y2=x**2
# 绘图
plt.plot(x, y2)
# 显示图像
plt.show()

3 情况3:一个画布里作图多个子图(多种方法)
- 1张画布
- 多个坐标轴系
- 分别包含1个图形
- 且按内部序号排列,图形上按表格排列
3.1 用plt.subplot()方式绘制多子图
3.1.1 plt.subplot()基本语法
- plt.subplot()方式绘制多子图,只需要传入简单几个参数即可:
- plt.subplot(rows, columns, current_subplot_index)
- 形如plt.subplot(2, 2, 1) 或者 plt.subplot(221),其中:
- rows表示最终子图的行数;
- columns表示最终子图的列数;
- current_subplot_index表示当前子图的索引;
- 这几个参数是可以连写在一起的,同样可以被识别
- 例如:上面的plt.subplot(2, 2, 1),写成plt.subplot(221),两者是等价的。
3.1.2 特殊点
- plt.subplot()方式绘制多子图时,不需要先创建一个figure
- #fig=plt.figure() #可以不需要figure
3.1.3 测试代码
import numpy as np
import matplotlib.pyplot as plt
#fig=plt.figure()  #可以不需要figure
# 子图1,散点图
plt.subplot(2, 2, 1)
plt.scatter(np.linspace(-2, 2, 5), np.random.randn(5))
# 子图2,折线图+网格
plt.subplot(2, 2, 2)
plt.plot(np.linspace(-2, 2, 5), np.random.randn(5))
plt.grid(True)
# 子图3,柱状图
plt.subplot(2, 2, 3)
x = np.linspace(0, 5, 5)
plt.bar(x, np.random.random(5))
plt.xticks(np.arange(0, 6))
# 子图4,饼图
plt.subplot(2, 2, 4)
plt.pie(np.random.random(5), labels=list("ABCDE"))
plt.show()
3.2 用plt.subplots() 方式绘制多子图
3.2.1 plt.subplots() 的基本语法
matplotlib.pyplot.subplots(nrows=1, ncols=1, *, sharex=False, sharey=False, squeeze=True, subplot_kw=None, gridspec_kw=None, **fig_kw)
- nrows:默认为 1,设置图表的行数。
- ncols:默认为 1,设置图表的列数。
- sharex、sharey:设置 x、y 轴是否共享属性,默认为 false,可设置为 'none'、'all'、'row' 或 'col'。 False 或 none 每个子图的 x 轴或 y 轴都是独立的,True 或 'all':所有子图共享 x 轴或 y 轴,'row' 设置每个子图行共享一个 x 轴或 y 轴,'col':设置每个子图列共享一个 x 轴或 y 轴。
- squeeze:布尔值,默认为 True,表示额外的维度从返回的 Axes(轴)对象中挤出,对于 N*1 或 1*N 个子图,返回一个 1 维数组,对于 N*M,N>1 和 M>1 返回一个 2 维数组。如果设置为 False,则不进行挤压操作,返回一个元素为 Axes 实例的2维数组,即使它最终是1x1。
- subplot_kw:可选,字典类型。把字典的关键字传递给 add_subplot() 来创建每个子图。
- gridspec_kw:可选,字典类型。把字典的关键字传递给 GridSpec 构造函数创建子图放在网格里(grid)。
- **fig_kw:把详细的关键字参数传给 figure() 函数。
3.2.2 作图步骤
- STEP1: 先设定figure 和 划分 axes子区域
- STEP2: 分配每个子区域的位置
- STEP3: 每个子区域单独作图
fig,axes=plt.subplots(2,2)
ax1=axes[0,0]
ax2=axes[0,1]
ax3=axes[1,0]
ax4=axes[1,1]
# 子图1,散点图
ax1.scatter(np.linspace(-2, 2, 5), np.random.randn(5))
3.2.3 直接修改 plt.subplot的代码,修改为 plt.subplots
import numpy as np
import matplotlib.pyplot as plt
# 把上面subplot代码改写为subplots
x = np.arange(0, 100)
#划分子图
fig,axes=plt.subplots(2,2)
ax1=axes[0,0]
ax2=axes[0,1]
ax3=axes[1,0]
ax4=axes[1,1]
# 子图1,散点图
ax1.scatter(np.linspace(-2, 2, 5), np.random.randn(5))
# 子图2,折线图+网格
ax2.plot(np.linspace(-2, 2, 5), np.random.randn(5))
plt.grid(True)
# 子图3,柱状图
x = np.linspace(0, 5, 5)
ax3.bar(x, np.random.random(5))
plt.xticks(np.arange(0, 6))
# 子图4,饼图
ax4.pie(np.random.random(5), labels=list("ABCDE"))
plt.show()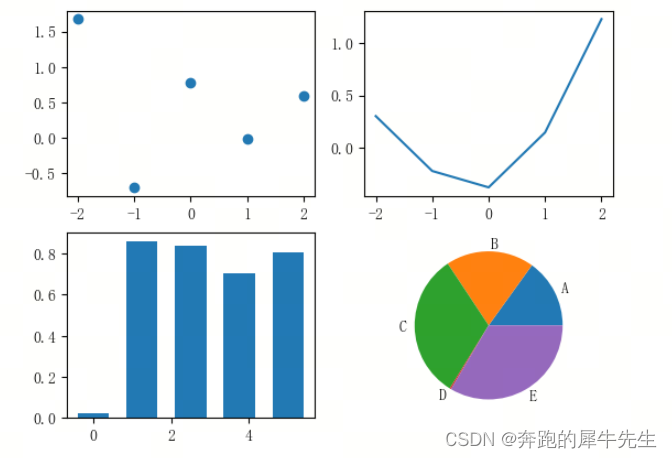
3.3 使用fig.add_subplot() 函数绘制图中图
3.3.1 基本语法
- fig.add_subplot(2,2,1)
- 这个语法和 plt.subplot() 相似
- 但是差别就是,这个是动态的设计子图
对比
方式1: plt.subplot()
- plt.subplot(2, 2, 1)
方式2: fig.add_subplot()
- ax1=fig.add_subplot(2,2,1)
- ax1.scatter(np.linspace(-2, 2, 5), np.random.randn(5))
3.3.2 测试代码
import numpy as np
import matplotlib.pyplot as plt
# 把上面subplot代码改写为,动态的fig.add_subplot()
#新建figure对象
fig=plt.figure()
x = np.arange(0, 100)
#划分子图
# 子图1,散点图
ax1=fig.add_subplot(2,2,1)
ax1.scatter(np.linspace(-2, 2, 5), np.random.randn(5))
# 子图2,折线图+网格
ax2=fig.add_subplot(2,2,2)
ax2.plot(np.linspace(-2, 2, 5), np.random.randn(5))
plt.grid(True)
# 子图3,柱状图
ax3=fig.add_subplot(2,2,3)
x = np.linspace(0, 5, 5)
ax3.bar(x, np.random.random(5))
plt.xticks(np.arange(0, 6))
# 子图4,饼图
ax4=fig.add_subplot(2,2,4)
ax4.pie(np.random.random(5), labels=list("ABCDE"))
plt.show()
4 情况4:用fig.add_axes() 实现图中图(其实是子图的一种)
4.1 基本语法
- fig.add_axes([left, bottom, width, height])
- 本质和上面用 fig.add_axes()实现多子图的方法差不多
- 所以,可以认为 图中图是另外一种形式的子图
4.2 步骤
- STEP1: 创建子图 ax1 = fig.add_axes([left, bottom, width, height])
- STEP2: 在子图中,画图,ax1.plot(x, y, 'r')
- STEP3: 标准子图的标题,ax1.set_title('area1')
4.3 测试代码1
import numpy as np
import matplotlib.pyplot as plt
#新建figure
fig = plt.figure()
# 定义数据
x = np.linspace(1,10,100)
y = np.cos(x)
#新建区域ax1
#figure的百分比,从figure 10%的位置开始绘制, 宽高是figure的80%
left, bottom, width, height = 0.1, 0.1, 0.8, 0.8
# 获得绘制的句柄
ax1 = fig.add_axes([left, bottom, width, height])
ax1.plot(x, y, 'r')
ax1.set_title('area1')
#新增区域ax2,嵌套在ax1内
left, bottom, width, height = 0.2, 0.6, 0.25, 0.25
# 获得绘制的句柄
ax2 = fig.add_axes([left, bottom, width, height])
ax2.plot(x,y, 'b')
ax2.set_title('area2')
plt.show()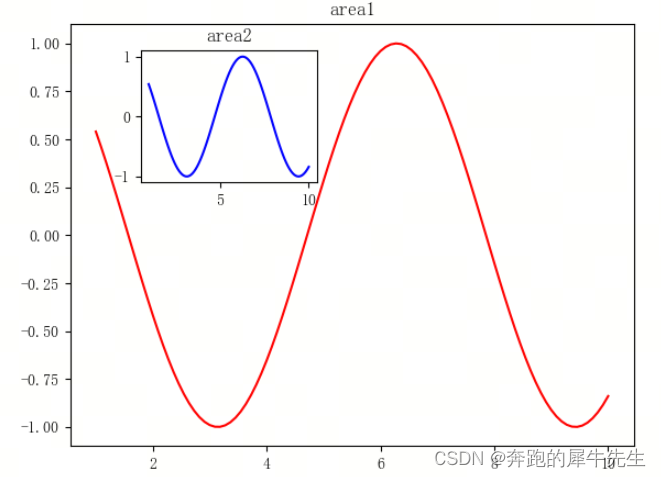
4.4 测试代码2
可以清晰的发现,图中图,就是子图的一种表现形式
4.4.1 添加子图区域
下面就是在figure里添加一个子图区域
- ax1=fig.add_axes([0.1,0.1,0.7,0.7])
4.4.2 定义子图区域的位置和大小 ax1=fig.add_axes([left, bottom, width, height])
- 下面2种写法相同
- ax1=fig.add_axes([left, bottom, width, height])
- 含义
- fig.add_axes([X起点百分比, Y起点百分比, X长度百分比, Y长度百分比])
- 写法1:
- left, bottom, width, height =0.1,0.1,0.7,0.7
- ax1=fig.add_axes([left, bottom, width, height])
- 写法2:
- ax1=fig.add_axes([0.1,0.1,0.7,0.7])
4.4.3 设置图例和标题,都是每个子图区域单独一套(独立显示)
- 如果加的是 plt.plot(,label="") 则必须匹配一个 plt.legend() 显示图例,并且是每个子图都需要一个单独的plt.legend()
- ax2.set_title("title: y=cos(x)") 可以单独设置每个figure的标题,也是每个子图区域单独一套
import numpy as np
import matplotlib.pyplot as plt
x1=np.linspace(-10,10,100)
y1=np.exp(x1)
x2=np.arange(-10,10,0.1)
y2=np.cos(x2)
fig=plt.figure()
#同left, bottom, width, height =0.1,0.1,0.7,0.7
#ax1=fig.add_axes([left, bottom, width, height])
ax1=fig.add_axes([0.1,0.1,0.7,0.7])
ax1.plot(x1,y1,"b",label="y=e^x")
plt.legend(loc="lower left")
ax1.set_title("title: y=e^x")
ax2=fig.add_axes([0.15,0.4,0.3,0.3])
ax2.plot(x2,y2,"r",label="y=cos(x)")
plt.legend(loc="lower left")
ax2.set_title("title: y=cos(x)")
plt.show()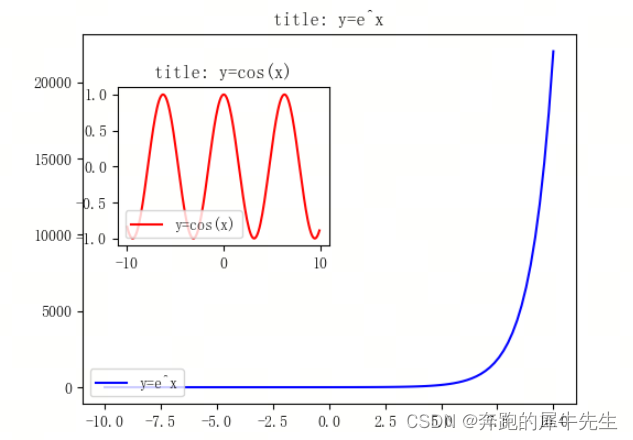
- ax1=fig.add_axes([0.1,0.1,0.7,0.7])
- plt.subplot(2, 2, 1)


