
MATLAB 图例
温馨提示:这篇文章已超过411天没有更新,请注意相关的内容是否还可用!
目录
创建
1.创建图例-legend函数
2. 自定义图例-text函数
外观
1.位置-Location
2.大小-Location
3.其他属性-TextColor、FontSize
高级技巧
1.自定义图例项标识-DisplayName
2.多列图例-NumColumns
3.隐藏特定数据系列-HandleVisibility
4.自动更新图例-AutoUpdate
5.LaTeX 表达式-Interpreter
创建
在 MATLAB 中,您可以使用`legend`函数来创建图例。图例可以显示不同曲线的标识符和颜色,并帮助解释图形的含义。
1.创建图例-legend函数
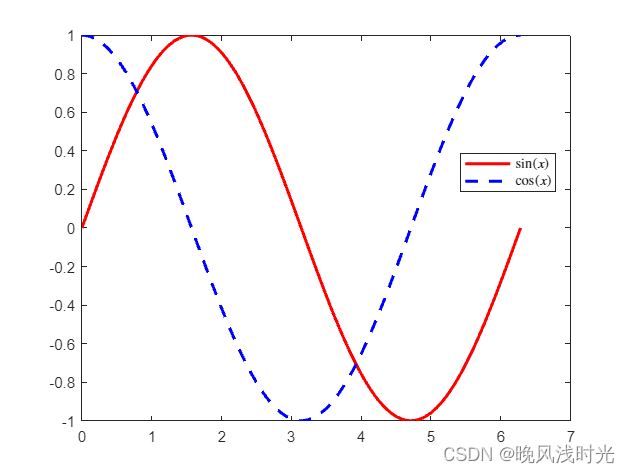
以下是创建和自定义图例的示例代码:
% 创建一些数据和曲线
x = linspace(0, 2*pi, 100);
y1 = sin(x);
y2 = cos(x);
figure; % 创建新的图形窗口
% 绘制曲线并设置线条属性
plot(x, y1, 'r', 'LineWidth', 2);
hold on; % 在同一图形窗口中保持曲线
plot(x, y2, 'b--', 'LineWidth', 2);
% 创建图例
legend('sin(x)', 'cos(x)', 'Location', 'best');
% 可选:自定义图例的其他属性
legend('boxoff'); % 关闭图例的边框
legend('FontSize', 12); % 设置图例文本的字体大小
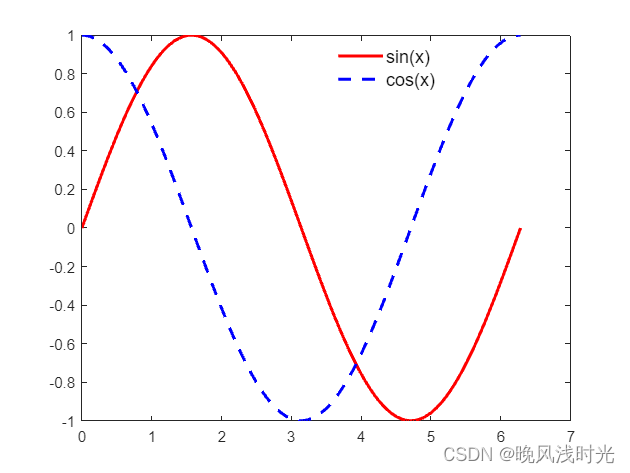
该示例将创建一个带有两个曲线的图形,并在图形的最优位置添加一个图例。您可以通过在`legend`函数中使用不同的参数来改变图例的位置和外观。
2. 自定义图例-text函数
如果您需要更多的灵活性来创建图例,您可以手动创建一个自定义图例。通过在图上使用文本标注和线条,您可以创建自己的图例。
x = linspace(0, 2*pi, 100);
y1 = sin(x);
y2 = cos(x);
figure;
plot(x, y1, 'r', 'LineWidth', 2);
hold on;
plot(x, y2, 'b--', 'LineWidth', 2);
legend_text1 = 'sin(x)';
legend_text2 = 'cos(x)';
text(0.2, 0.9, legend_text1, 'Color', 'r', 'FontSize', 12);
text(0.2, 0.8, legend_text2, 'Color', 'b', 'FontSize', 12);
line([0.1, 0.15], [0.89, 0.89], 'Color', 'r', 'LineWidth', 2);
line([0.1, 0.15], [0.79, 0.79], 'Color', 'b', 'LineStyle', '--', 'LineWidth', 2);
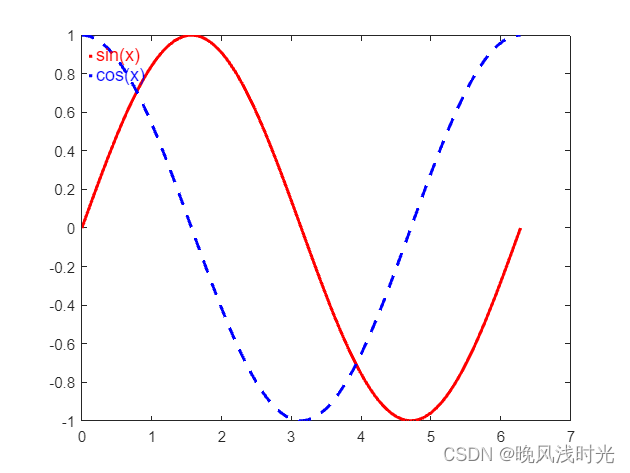
在这个示例中,我们使用`text`函数创建了两个文本标注作为图例项,并使用`line`函数创建了对应的线条。您可以根据需要调整位置、颜色和样式以及文本的格式
外观
1.位置-Location
图例位置选项:`legend`函数有几个选项可用于指定图例的位置。常用的选项包括:`'best'`(自动选择最佳位置)、`'northwest'`、`'northeast'`、`'southwest'`、`'southeast'`等。您还可以使用数字向量指定图例的位置,例如`[0.2, 0.8, 0.1, 0.1]`表示图例左下角的位置和大小。
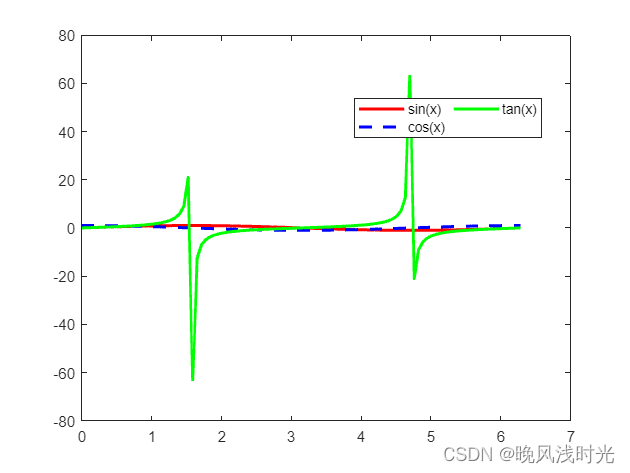
x = linspace(0, 2*pi, 100);
y = [sin(x); cos(x); tan(x)];
figure;
plot(x, y(1,:), 'r', 'LineWidth', 2, 'DisplayName', 'sin(x)');
hold on;
plot(x, y(2,:), 'b--', 'LineWidth', 2, 'DisplayName', 'cos(x)');
plot(x, y(3,:), 'g-', 'LineWidth', 2, 'DisplayName', 'tan(x)');
legend('Location', [0.2, 0.8, 0.1, 0.1]);

2.大小-Location
调整图例的大小:您可以使用`legend`函数的`'Position'`选项来自定义图例的大小。
x = linspace(0, 2*pi, 100);
y1 = sin(x);
y2 = cos(x);
figure;
plot(x, y1, 'r', 'LineWidth', 2, 'DisplayName', 'sin(x)');
hold on;
plot(x, y2, 'b--', 'LineWidth', 2, 'DisplayName', 'cos(x)');
legend('Location', 'northeast', 'Location', [0.7, 0.2, 0.15, 0.2]);

在这个示例中,图例的位置被设置为右上角,通过调整`Position`参数中的坐标值,您可以将图例放置在其他位置,并通过调整宽度和高度来调整图例的大小。
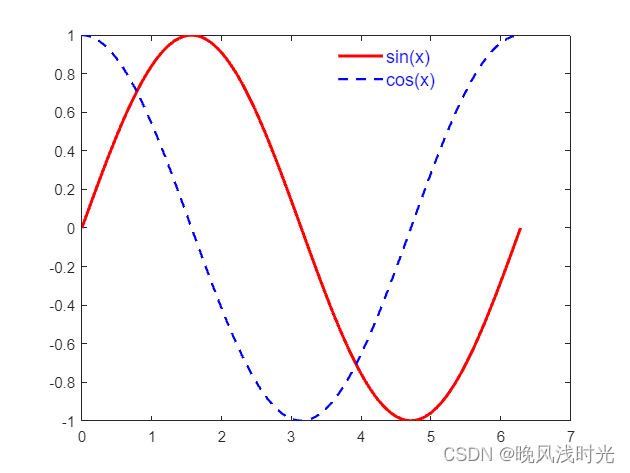
3.其他属性-TextColor、FontSize
使用图例项的其他属性:您可以通过设置`plot`函数中的属性和使用`legend`函数的选项来定制图例项的外观。例如,您可以设置曲线的颜色和线型,以及图例项的线宽和样式。
x = linspace(0, 2*pi, 100);
y1 = sin(x);
y2 = cos(x);
figure;
plot(x, y1, 'r', 'LineWidth', 2, 'DisplayName', 'sin(x)');77
hold on;
plot(x, y2, 'b--', 'LineWidth', 1.5, 'DisplayName', 'cos(x)');
legend('Location', 'best', 'TextColor', 'blue', 'FontSize', 12, 'EdgeColor', 'none');
高级技巧
1.自定义图例项标识-DisplayName
可以使用不同的标识符表示每个数据系列。您可以在`plot`函数中使用`DisplayName`参数来为每个曲线指定标识符,并在创建图例时使用`legend`函数的`'DisplayName'`选项来显示这些标识符。
x = linspace(0, 2*pi, 100);
y1 = sin(x);
y2 = cos(x);
figure;
plot(x, y1, 'r', 'LineWidth', 2, 'DisplayName', 'sin(x)');
hold on;
plot(x, y2, 'b--', 'LineWidth', 2, 'DisplayName', 'cos(x)');
legend('Location', 'best');

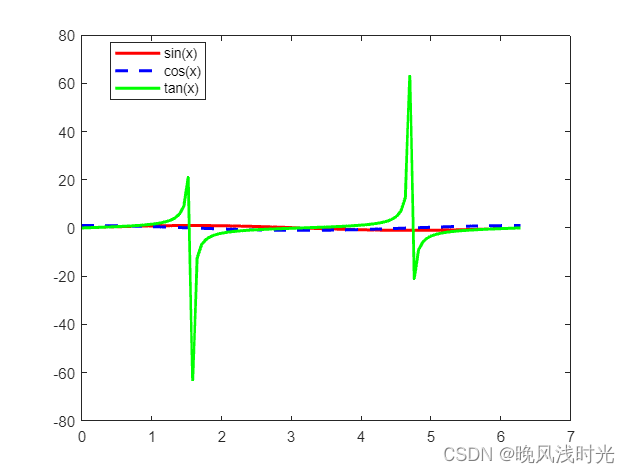
2.多列图例-NumColumns
如果您有很多数据系列,并且希望将图例分成多列以便更好地排列,可以使用`'NumColumns'`选项。
x = linspace(0, 2*pi, 100);
y1 = sin(x);
y2 = cos(x);
y3 = tan(x);
figure;
plot(x, y1, 'r', 'LineWidth', 2, 'DisplayName', 'sin(x)');
hold on;
plot(x, y2, 'b--', 'LineWidth', 2, 'DisplayName', 'cos(x)');
plot(x, y3, 'g-', 'LineWidth', 2, 'DisplayName', 'tan(x)');
legend('Location', 'best', 'NumColumns', 2);
3.隐藏特定数据系列-HandleVisibility
果您有多个数据系列,但只想在图例中显示其中一部分,可以使用`'HandleVisibility'`属性。将需要隐藏的曲线的`'HandleVisibility'`设置为`'off'`,然后再创建图例即可。
x = linspace(0, 2*pi, 100);
y1 = sin(x);
y2 = cos(x);
y3 = tan(x);
figure;
plot(x, y1, 'r', 'LineWidth', 2, 'DisplayName', 'sin(x)');
hold on;
plot(x, y2, 'b--', 'LineWidth', 2, 'DisplayName', 'cos(x)');
plot(x, y3, 'g-', 'LineWidth', 2, 'HandleVisibility', 'off');
legend('Location', 'best');

4.自动更新图例-AutoUpdate
当您在运行不断更新的循环中绘制曲线时,您可以使用`'AutoUpdate'`选项来自动更新图例。
x = linspace(0, 2*pi, 100);
figure;
for i = 1:10
y = sin(x + i/10);
plot(x, y, 'LineWidth', 2, 'DisplayName', ['sin(x + ' num2str(i/10) ')']);
hold on;
pause(0.3);
legend('Location', 'best', 'AutoUpdate', 'on');
end
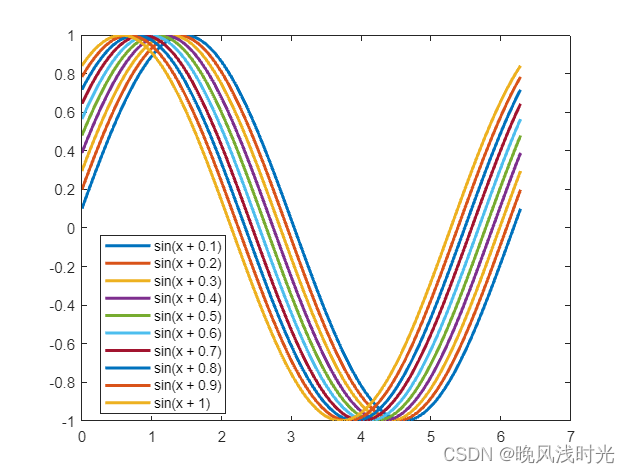
在这个示例中,您将在循环中绘制10个曲线,每次迭代时都会自动更新图例以反映新的曲线。
5.LaTeX 表达式-Interpreter
使用 LaTeX 标签和格式化文本:您可以在图例项中使用 LaTeX 表达式来显示数学符号、希腊字母等。通过在标识符字符串前面加上`'$'`和`'$'`,您可以将其解释为 LaTeX 表达式。
x = linspace(0, 2*pi, 100);
y1 = sin(x);
y2 = cos(x);
figure;
plot(x, y1, 'r', 'LineWidth', 2, 'DisplayName', '$\sin(x)$');
hold on;
plot(x, y2, 'b--', 'LineWidth', 2, 'DisplayName', '$\cos(x)$');
legend('Interpreter', 'latex', 'Location', 'best');
在这个示例中,图例项中的标识符字符串被解释为 LaTeX 表达式,并在图例中以数学符号的形式显示。
(代编图形代码,后台私信)


